
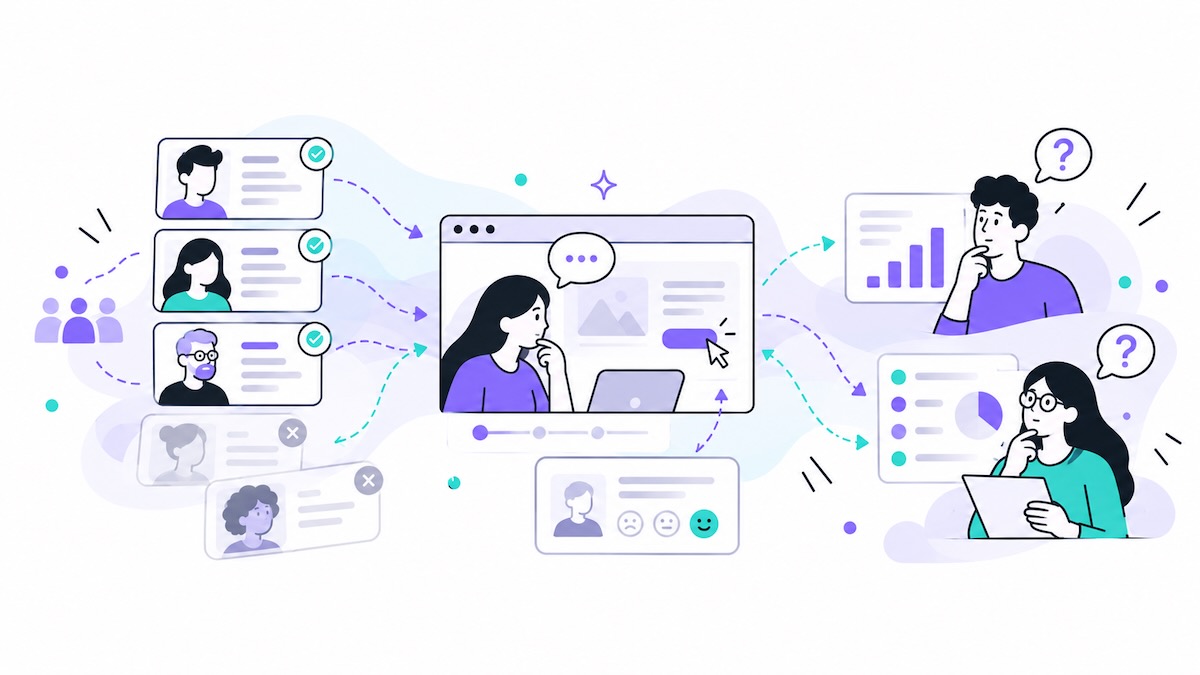

The useful question is not whether user research is biased. It is which sources of error could affect a particular study, how much confidence the evidence deserves, and what can be done to improve it. This article focuses on measurable findings, distinguishing recent research from older studies and vendor-published data.
For how research with real participants compares with synthetic users, see our guide to synthetic users.
The short answer:
- Recruitment shapes the sample. Different panels can produce different data quality, and screeners do not always prevent ineligible or fraudulent participants.
- Reported behavior is not observed behavior. People misremember usage, overstate hypothetical willingness to pay, and can believe they completed tasks they failed.
- The session can influence the result. Interviewer cues and leading questions can shift responses. Think-aloud can affect timing and dropout, although evidence about task performance is mixed.
- Analysis is not perfectly reproducible. Researchers watching the same usability sessions often identify different problems and assign different severity ratings.
- Small samples have limits. Five users can reveal common issues in a narrow group; they cannot reliably reveal every rare problem or support population-level estimates.
- AI does not remove the need for judgment. Early studies suggest it can help apply a coding scheme, but can also miss themes or generate questionable ones.
- The remedy is better design and triangulation. Verify behavior where possible, document recruitment and methods, use neutral prompts, and make uncertainty visible.
Contents
- Common named biases in user research
- 1. Who takes part: recruitment and sample bias
- 2. What people say versus what they do
- 3. How the session shapes the answer
- 4. How analysis adds bias
- 5. The research that never happens
- 6. How to reduce bias in user research
- 7. What this means for methods calibrated against users
- Frequently asked questions
Common named biases in user research
Research bias is often discussed as a list of cognitive biases, but the risks do not all operate in the same way. Some affect who participates, some shape answers, and others influence what researchers notice or remember. This table is a quick map; the sections below explain the evidence and safeguards in more detail.
| Bias | Where it can appear | Practical safeguard |
|---|---|---|
| Selection bias | Recruitment and sampling | Compare the sample with the intended audience and document who is missing |
| Social-desirability bias | Interviews and surveys | Reduce pressure to give an acceptable answer; use neutral wording and private response options where appropriate |
| Framing bias | Questions, prompts and concepts | Test neutral alternative wording and avoid implying a preferred answer |
| Anchoring bias | Concept comparisons and estimates | Randomize presentation order or provide independent judgments before discussion |
| Primacy and recency effects | Recall and ordered comparisons | Rotate order where feasible and capture observations throughout the session |
| Peak-end effect | Retrospective experience ratings | Ask about specific moments as well as the overall experience |
| False-consensus bias | Interpretation and decision-making | Separate observed evidence from assumptions about what “most users” think |
| Hindsight bias | Post-study interpretation | Preserve hypotheses and predictions before reviewing results |
| Halo effect | Ratings and evaluator judgments | Assess concrete behaviors and criteria rather than an overall impression |
| Confirmation bias | Analysis and reporting | Search for disconfirming cases and record alternative explanations |
| Observer effect | Moderated or observed sessions | Keep instructions consistent and consider whether observation changes the behavior being measured |
| Self-report bias | Surveys and post-task ratings | Separate perceptions from observed outcomes and verify behavior when possible |
| Evaluator effect | Usability analysis | Use shared criteria and, for important findings, more than one independent reviewer |
These labels overlap and are not a validated taxonomy of 13 independent mechanisms. They are useful search terms and prompts for checking a study design. The relevant question is which risks are plausible for the method and decision at hand.
1. Who takes part: recruitment and sample bias
Before a participant answers a question, recruitment has already shaped the evidence. A sample drawn from a panel, customer list, specialist community or open call will not necessarily represent the same people.
Panel quality can vary
A study comparing five online panels with 2,429 respondents found that the share passing both attention checks ranged from 22% to 69% (Peer et al., Behavior Research Methods, 2022). The study was funded by one of the platforms, so platform rankings should be interpreted cautiously. The broader lesson is that samples described as “real users” can differ substantially in quality.
Screeners are not a perfect safeguard. In the same study, 48% to 60% of respondents already filtered for high approval ratings and experience falsely claimed eligibility when asked an imposter question. This does not mean that half of all research participants are fraudulent; it shows that screeners can fail under particular conditions.
Fraud is a real risk in specialist recruitment
Qualitative studies can also be targeted. In a 2024 health-services study, an open call with a small e-voucher incentive attracted 254 sign-ups within 24 hours. All 25 people selected for interviews and focus groups were ultimately judged likely imposters. Researchers described warning signs including unusually timed sign-ups, the same voice appearing in more than one interview, and repeated questions about the gift card (Sharma et al., BMC Health Services Research, 2024).
A 2025 paper describing three US studies reported other cases: 3 of 27 enrolled “clinicians” in one study were considered fraudulent, while 63 of 318 people who expressed interest in another were screened out as suspected fraud (Hill et al., Journal of Medical Internet Research, 2025).
These are documented cases, not estimates of the overall fraud rate in UX research. Risk may be higher when recruitment targets specialist, difficult-to-reach groups or offers attractive incentives, but that pattern should not be assumed for every study.
A 2026 methodological study of an international web survey of people living with Long COVID shows how large the problem can become in a specific high-risk setting. Of 4,663 responses to the first questionnaire (Time 1), 798 (17%) were retained; of 1,281 responses to the follow-up questionnaire (Time 2), 629 (49%) were retained. The paper describes screening and fraud-detection procedures as well as the difficulty of distinguishing fraudulent entries from valid participants (Journal of Medical Internet Research, 2026). These figures should not be generalized to ordinary UX recruitment, but the study is a useful reminder to report exclusions and their rationale.
Incentives change participation—and require safeguards
Incentives can improve recruitment and attendance, but they may also change who signs up. In a randomized recruitment study by RTI International, offering $5 or $15 tripled eligible sign-ups compared with no incentive. Fraud rates in the paid groups were 4.7% and 4.5%. The no-incentive group had no detected fraud among 24 completed responses—but that small group cannot establish that removing incentives eliminates fraud (Sobolewski et al., JMIR Formative Research, 2024).
The trade-off is not simply “incentives or no incentives.” Incentives can broaden participation and reduce participant burden; they also need proportionate checks. In platform data covering around 14,000 moderated studies, the average no-show rate was 8.6%, and larger incentives were associated with fewer no-shows (MeasuringU, 2024).
For higher-risk recruitment, use more than a single screener answer. Check consistency across responses, confirm relevant experience with concrete follow-up questions, and use proportionate identity or eligibility checks where appropriate. Avoid collecting more personal information than the study needs.
Verification also has a cost. Overly rigid checks can exclude legitimate participants, including people who are new to research, have different communication styles, or face barriers to identity verification. Treat any one signal as a reason to investigate rather than proof of fraud, and review ambiguous cases with inclusion in mind (Great Question’s discussion of participant fraud makes this trade-off explicit).
AI-assisted answers can enter human samples
A participant may be a real person and still use AI to generate a response. In a 2023 Prolific study, researchers estimated that 33.3% of crowdworkers used large language models for a writing task. Asking participants not to use LLMs and presenting the prompt as an image reduced measured use from 27.6% to 15.9% (Veselovsky et al., arXiv, 2023).
The study also found that LLM-assisted responses were more similar to one another than responses classified as human-written: 45.6% versus 27.1% on the study’s similarity measure. Undetected AI help may make a sample appear more homogeneous than it is. This was one crowdwork task, not a universal estimate of AI use in research.
Design tasks around concrete experience, ask participants to describe specific events, and treat generic or repetitive responses as a signal to investigate—not automatic proof of fraud.
A sample may not represent the people who will use the product
A review of CHI papers from 2016–2020 found that 73% of participant samples came from Western countries, which account for about 11.8% of the world’s population (Linxen et al., CHI 2021). A 2024 follow-up analysis found that 75.93% of CHI samples were Western-only (Septiandri et al., ICWSM 2024). This concentration matters when considering how broadly findings may generalize.
These findings concern published HCI research, not every product team’s customer research. They illustrate a general problem: evidence from one population does not automatically transfer to another. Language, local conventions, disability, income, device access and familiarity with a product category can change the experience.
What to do: describe who took part and how they were recruited. Compare the sample with the users the product is meant to serve, and avoid presenting a narrow sample as representative of a wider population.
2. What people say versus what they do
Self-report is useful for understanding perceptions, motives and interpretations. It is weaker as a substitute for observable behavior—especially when people must remember, estimate or predict what they did.
People misremember their own usage
A meta-analysis comparing self-reported digital-media use with logged use found a correlation of only r = 0.38 across 52,007 participants. Only around 6% of comparisons had self-reports within 5% of actual use, and people tended to over-report duration (Parry et al., Nature Human Behaviour, 2021).
A question such as “How often do you use this feature?” produces a recollection, not an analytics event. Ask about a recent, specific instance where possible, and compare the account with logs or other behavioral evidence if the distinction matters.
Hypothetical willingness to pay can be inflated
A meta-analysis of 77 studies found that hypothetical willingness to pay exceeded real willingness to pay by 21% on average. The gap was larger for higher-value and specialty products (Schmidt & Bijmolt, Journal of the Academy of Marketing Science, 2020).
“I’d pay for that” can be a useful signal of interest, but it is not the same as a purchase. For pricing decisions, combine interview feedback with stronger behavioral evidence, such as a real choice, a paid pilot, a deposit or transaction data, depending on what is ethical and practical.
The gap between perceived usability and performance is not simply a matter of people misreporting. A 2026 meta-analysis of 105 studies comparing the System Usability Scale (SUS) with workload, task time and error rate found that SUS was related to performance measures but not interchangeable with them. In 24% of studies, the system with the higher SUS score also had worse task-time performance; in 23%, it had worse error-rate performance. SUS adds information about perceived usability, but it cannot stand in for observed performance (Hertzum, International Journal of Human–Computer Interaction, 2026). Satisfaction, workload and effectiveness are related but distinct constructs; measure the one that matches the decision.
Participants can think they succeeded when they did not
In four unmoderated studies covering 838 participants and 34 tasks, participants reported completing 93% of tasks, while verified completion was 33% (MeasuringU, 2015). In a separate analysis of 123 usability tests, 14% of failed task attempts still received the highest possible ease rating (MeasuringU, 2009).
These are older, vendor-published datasets, not a current universal rate. They demonstrate why confidence and satisfaction ratings cannot stand in for task success. A participant may misunderstand the goal, stop at the wrong point, or believe an action worked when it did not.
What to do: define success criteria before testing. Record whether the task was actually completed, use event logs or transaction outcomes where relevant, and report self-reported ease separately from observed success.
3. How the session shapes the answer
Research does not happen in a vacuum. The moderator’s presence, question wording and data-collection method can influence what people say and how they behave.
Interviewer and courtesy effects
In a 2012 HCI experiment conducted in India, participants compared two videos that were actually identical. They were 2.5 times more likely to prefer the version they believed the interviewer had made. When the interviewer’s version was deliberately degraded, 54% of one participant group still chose it when interviewed by a foreign researcher (Dell et al., CHI 2012).
The study is older and context-specific, so its effect size should not be projected onto every interview. It illustrates a risk for founders, designers or product managers asking people to evaluate their own work: participants may soften criticism when they know who created the product.
A 2025 review, The Social Desirability Atlas, synthesizes evidence on social-desirability bias across multiple domains and examines why some standard remedies can fail—for example, by confusing respondents or making a question feel more sensitive (Bursztyn et al., NBER Working Paper 33920). The implication is not that one question format works everywhere. Choose the mitigation for the sensitivity and context of the question, and test whether it actually improves response quality.
When feasible, use a neutral moderator who is not responsible for the design. If that is not possible, avoid defending the product and ask what happened rather than whether the participant “liked” it.
Leading questions can steer answers
Question wording can materially change responses. In a split-sample experiment, YouGov found that different leading versions of the same political question moved net support by 37 percentage points (YouGov, 2023). This was not a product study; it illustrates the mechanism rather than a typical effect size for UX interviews.
Compare “Was the checkout easy?” with “What, if anything, was difficult about checking out?” The first assumes a positive frame and invites agreement; the second leaves room for different experiences. Questions that presuppose success or ask participants to validate an idea can shape the answer.
What to do: use neutral, open-ended prompts; pilot the interview guide; ask for examples; and distinguish what participants volunteered from what emerged only after prompting.
Being observed: there is no single Hawthorne effect
The Hawthorne effect is often used as shorthand for people changing behavior when they know they are being studied. A systematic review of 19 studies concluded that there is “no single Hawthorne effect.” The pooled effect was modest, and randomized trials alone did not show a statistically significant effect (McCambridge et al., Journal of Clinical Epidemiology, 2014).
In usability research, observers may increase stress, but the effect on task success is inconsistent. Practitioner summaries also suggest that moderated and unmoderated formats can produce different task times even when average completion and ease ratings are similar (MeasuringU on observer effects; MeasuringU on lab-moderated versus remote-unmoderated testing).
Treat observation as a possible influence to manage rather than assuming it always invalidates results. Keep instructions consistent, give participants time to get comfortable, and choose a format that fits the question.
Think-aloud is a trade-off
Asking participants to narrate their thoughts can reveal confusion that would otherwise be invisible. It can also change the session.
Across 10 remote unmoderated studies with 423 participants, think-aloud tasks were around 16–20% slower and ease and confidence ratings were about 5% lower. In randomized online studies, dropout was 50% with think-aloud compared with 19% without (MeasuringU’s think-aloud summary, 2024). The method also helped analysts find 36–50% more problems.
Evidence about behavioral reactivity is mixed: a controlled 2018 lab study with 60 participants found no statistically significant effect on task performance (CHI 2018 study). These results do not establish that think-aloud is inherently bad. It may reveal more problems while making task-time comparisons less representative and changing who completes a remote study.
What to do: use think-aloud when understanding reasoning is central. If speed or natural behavior is the outcome, consider a silent comparison condition and report the method clearly.
4. How analysis adds bias
The data collected in a study do not interpret themselves. Researchers decide what counts as a problem, which observations matter, how severe each issue is and which themes make it into the report.
Measurement choices need scrutiny
Measurement quality also depends on how researchers select and report their instruments. A systematic quantitative review of 60 CHI papers found that only 20% gave a complete rationale for choosing a scale, 30% shared all scale items, and 36.67% reported any investigation of scale quality (Frontiers in Computer Science, 2024). This review covered papers published from 2019 to 2022, not all UX research, but it highlights a reporting problem: a score is difficult to interpret if readers cannot tell why the measure was chosen or how well it fits the construct.
Different evaluators see different problems
In the CUE-9 study, 19 experienced usability professionals watched recordings of the same five users. On average, each evaluator reported only about a third of all the problems found by the group. For problems identified by more than one evaluator, 24–30% were rated critical by one evaluator and minor by another (Hertzum, Molich & Jacobsen, Behaviour & Information Technology, 2014).
A review of 33 studies found median agreement between two evaluators of 27%. Agreement rose to a median of 59% when tasks and users were held fixed, and was lower when teams designed their own studies (MeasuringU, 2018). This is older evidence, and the review includes practitioner-published analysis of earlier studies rather than a new contemporary replication.
A 2023 follow-up examined four evaluators independently reviewing the same 16 unmoderated think-aloud videos. Their average pairwise agreement was 41%; 47% of the 38 consolidated issues were identified by only one evaluator, while 18% were identified by all four (Sauro et al., MeasuringU, 2023). This is a small, task-specific study, but it provides a more recent illustration of the same effect: even when evaluators see the same sessions, they do not produce identical problem lists.
The implication is not that usability findings are arbitrary. A report reflects both what participants did and what analysts noticed. Which problems are included—and how severe they are judged to be—can depend on who reviews the evidence.
What to do: have more than one person review key sessions or a sample of recordings; agree on severity criteria in advance; keep evidence excerpts with each finding; and distinguish direct observations from interpretations.
The “five users” rule is conditional
The familiar claim that five users reveal 85% of usability problems is often repeated as if it were universal. It depends on assumptions about how common each problem is. The model behind the rule assumes problems affect about 31% of users on average. Five users may reveal many common problems, but catch only about half of the problems affecting 15% of users; a problem affecting 10% of users may require around 18 participants to be observed at least once with high probability (MeasuringU, 2010).
The Nielsen Norman Group’s guidance distinguishes qualitative usability testing of one user group from quantitative studies, for which it recommends larger samples. For qualitative interviews, a systematic review of 23 studies found that thematic saturation often occurred after 9–17 interviews or 4–8 focus groups, mainly in relatively homogeneous populations (Hennink & Kaiser, Social Science & Medicine, 2022).
These are not competing universal rules. They address different goals and assumptions. A small sample can be useful for discovering frequent issues in a narrow group. It is weaker for rare failures, accessibility needs, comparisons between segments and estimates intended to generalize to a population.
Confirmation bias and selective reporting
Researchers and stakeholders may pay more attention to findings that support an existing belief, or select memorable quotes that tell a cleaner story than the full dataset. These risks are widely discussed in research practice, but we did not find a reliable estimate of how often confirmation bias or cherry-picking occurs across industry UX research. It would be misleading to present them as quantified industry-wide rates.
Process can reduce the opportunity for selective interpretation. Write down assumptions before a study, preserve recordings and raw notes, review contradictory cases, and wait until planned sessions are complete before settling on conclusions. Where possible, compare qualitative findings with analytics, support tickets, experiments or other independent evidence.
AI-assisted synthesis needs human checks
AI can speed up transcription, summarization and coding, but its outputs still need to be checked against the source material.
In a 2026 study, GPT-4o applying an existing human-built codebook achieved 96% raw agreement with human coders, with a mean Cohen’s kappa of 0.71 across 2,352 coding decisions. When asked to discover codes independently, 42.3% of its generated codes were judged unreasonable, and it missed 21 of 49 human codes (DeRegnaucourt et al., JMIR Formative Research, 2026). The study analyzed one focus group of four students, so its results are an early case study rather than a general benchmark for AI research tools.
A 2025 preprint reported further problems in AI-assisted qualitative analysis, including missed human-identified themes and summaries presented in place of verbatim excerpts (Parkington et al., arXiv, 2025). As a preprint, it should be treated as preliminary evidence.
The practical distinction is between asking AI to organize material using a defined framework and asking it to discover what matters without much direction. Neither should be treated as infallible.
What to do: verify generated codes against transcripts, preserve links to underlying excerpts, check quotations word-for-word, and review cases that contradict the dominant theme. Use AI to support analysis, not to replace the evidentiary trail.
5. The research that never happens
Bias can also enter before a study begins: through which questions receive research time, which users are reachable, and which findings teams have the capacity to investigate.
Industry surveys suggest that research work is often distributed across people with different levels of training. In a 2024 survey of 759 research professionals, the median team reported around eight studies per six months; 14% said their organization had no dedicated researchers (User Interviews, State of User Research 2024). The survey also reported recruitment and participant quality as common challenges. In its 2025 report, 74% of respondents said they prioritized research based on timeline or speed (User Interviews, 2025). Maze’s 2026 industry survey reported that 46% of organizations offered structured training for non-researchers who conduct research (Maze, 2026).
These are vendor surveys with self-selected respondents, not representative censuses of all product teams. They cannot tell us exactly how much shipped software has never been tested. They do suggest that research capacity, recruitment friction and time pressure are practical constraints worth acknowledging.
When time is limited, teams may repeatedly study easy-to-recruit users, skip follow-up on ambiguous findings, or rely on whoever is available to run sessions. The risk is not that every study conducted by a non-specialist is poor. It is that limited capacity makes it harder to recruit broadly, check assumptions and repeat a study when the evidence is unclear.
6. How to reduce bias in user research
No checklist can eliminate every source of error. The goal is to make the main risks visible and use methods that fit the claim the team wants to make.
| Source of error | What can go wrong | Practical response |
|---|---|---|
| Recruitment and panel bias | The sample differs from the intended users | Document recruitment sources; compare sample characteristics with the target group, including disability, language, device access and experience where relevant |
| Eligibility fraud | Participants may not have the experience they claim | Use concrete follow-up questions and proportionate verification for high-risk segments |
| Incentive effects | Incentives may change who signs up and attendance | Set incentives deliberately; combine them with quality checks |
| AI-assisted participant responses | Responses may be generic or unusually similar | Ask about specific lived experiences; investigate suspicious patterns |
| Self-report and recall | Usage or success may be misremembered | Ask about recent events and verify with logs or observed completion where possible |
| Hypothetical preferences | Stated interest may not translate into action | Treat intentions as signals; seek behavioral evidence for high-stakes decisions |
| Interviewer and courtesy effects | Participants may soften criticism | Use a neutral moderator where feasible and avoid defending the product |
| Leading questions | Wording nudges answers | Pilot neutral questions; ask what happened before asking for an evaluation |
| Observation and think-aloud | The session may affect timing, stress or dropout | Match method to the question; report the setup and its limitations |
| Evaluator disagreement | Analysts identify different problems or severity | Use multiple reviewers, shared criteria and evidence-linked findings |
| Small samples | Rare issues or subgroup differences are missed | Match sample size to issue frequency and user diversity |
| Confirmation bias | Findings fit prior expectations | Record assumptions in advance, preserve disconfirming evidence and review as a team |
| AI-assisted analysis | Themes or quotes may be missed or distorted | Check codes and excerpts against original recordings or transcripts |
Use this checklist to audit a study before drawing conclusions. It covers four places where bias can enter: recruitment, the research session, self-reported data, and analysis.
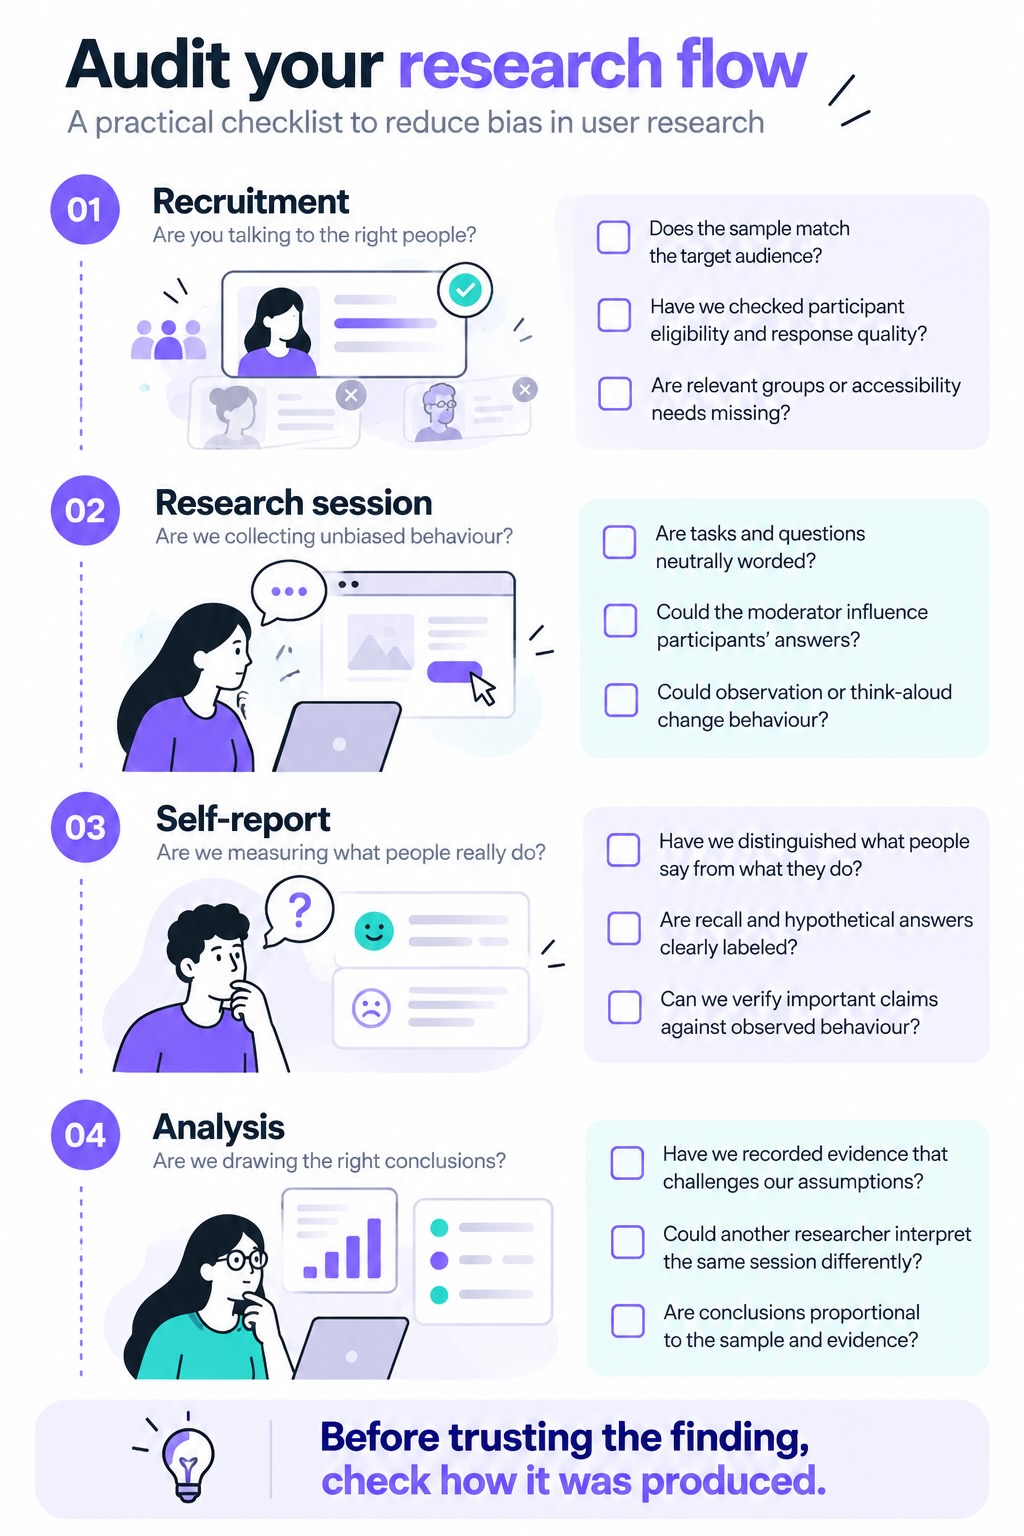
- [ ] Is it clear who participated, how they were recruited and who may be missing?
- [ ] Are observed actions separated from what participants said or believed?
- [ ] Were the tasks and questions neutral, and are the study conditions documented?
- [ ] Are findings supported by concrete observations or transcript excerpts?
- [ ] Have contradictory cases and alternative interpretations been considered?
- [ ] Are severity ratings and conclusions reviewed by someone besides the original analyst?
- [ ] Does the conclusion stay within what this sample and method can support?
7. What this means for methods calibrated against users
Real-user research is a reference point for newer methods, including analytics models, AI-assisted synthesis and synthetic users, which have their own documented biases. Its limitations matter because a method calibrated against real-user data can inherit the limitations of that data.
For example, if a model is tuned to match self-reported task success, it may reproduce the gap between perceived success and verified completion. If the source sample excludes a group, calibration against it cannot by itself establish validity for that group.
This is not an argument that synthetic methods are as biased as real-user research, or that one can replace the other. Better human evidence provides a stronger benchmark for evaluating another method, but does not guarantee that method will generalize. Each method needs to be validated for the claim it is being used to support.
Where possible, compare research outputs with observed behavior: verified task completion, product logs, transactions or other relevant outcomes. Use real participants to understand context, language, motivations and unexpected behavior; use other methods as complementary tools, with their own limits made explicit.
The central lesson is simple: having real people in a study is necessary for some questions, but it does not automatically make every conclusion reliable. Evidence quality depends on recruitment, task design, observation, analysis and the strength of the claim being made.
Frequently asked questions
What is bias in user research?
Bias in user research is a systematic influence that makes findings differ from the experience or behavior the study is trying to understand. It can enter through recruitment, question wording, the session itself, self-report, analysis or selective reporting. Not every difference is bias; some variation is random, and some reflects real differences between users.
What is the say-do gap?
The say-do gap is the difference between what people say they do, intend to do or believe they would do, and what they actually do. It can arise from imperfect memory, social desirability, hypothetical choices and the limits of self-awareness. Interviews and surveys are useful for understanding perceptions and motives, but behavioral claims are stronger when checked against observed task performance, product logs or other relevant evidence.
What are the most important biases in usability testing?
Common risks include selection bias, social-desirability and framing effects, participants misjudging whether they completed a task, think-aloud effects, evaluator disagreement and missing rare problems because the sample is small. Which matters most depends on the study’s purpose. The named-bias table above is a quick reference, not a ranking of severity.
Is five users enough for usability testing?
Sometimes. Five participants can reveal many common usability problems in one relatively homogeneous user group. It is not a universal sample-size rule, and it is not sufficient by itself for quantitative estimates, reliable subgroup comparisons or rare problems.
Does thinking aloud make usability testing less reliable?
Not necessarily. Think-aloud can reveal reasoning and uncover more problems, but it can also make tasks slower and change who completes a remote study. Evidence about its effect on task performance is mixed. Choose it based on the question and disclose the method’s trade-offs.
How can a team reduce bias in user interviews?
Recruit participants who match the question, ask about concrete past behavior, use neutral prompts, avoid defending the product, preserve the source material and review findings with another person. For decisions about behavior, compare interview accounts with observable evidence when possible.
Can AI remove bias from research analysis?
No. AI may help organize material, but it can miss themes, generate questionable codes or paraphrase rather than preserve a participant’s exact words. Check AI-generated outputs against transcripts and retain an auditable link from each conclusion to its evidence.
Disclosure: Synthers AI builds synthetic-user testing tools. The studies cited above are independent unless otherwise indicated. MeasuringU, User Interviews, Maze and YouGov are research or survey organizations reporting their own data. Vendor findings are identified in context and should be interpreted with that limitation in mind.